What is Autometrics?
Autometrics is an observability micro-framework built for developers. It makes it easy to instrument any function with the most useful metrics: request rate, error rate, and latency. Autometrics uses instrumented function names to generate Prometheus queries so you don't need to hand-write complicated PromQL.
To make it easy for you to spot and debug issues in production, Autometrics inserts links to live charts directly into each function's doc comments and provides dashboards that work out of the box. It also enables you to create powerful alerts based on Service-Level Objectives (SLOs) directly in your source code. Lastly, Autometrics writes queries that correlate your software's version info with anomalies in the metrics to help you quickly identify commits that introduced bugs or latency.
Autometrics is built on the excellent Prometheus and OpenTelemetry open source projects.
Demo
Here's a simple overview video for Autometrics
Getting started
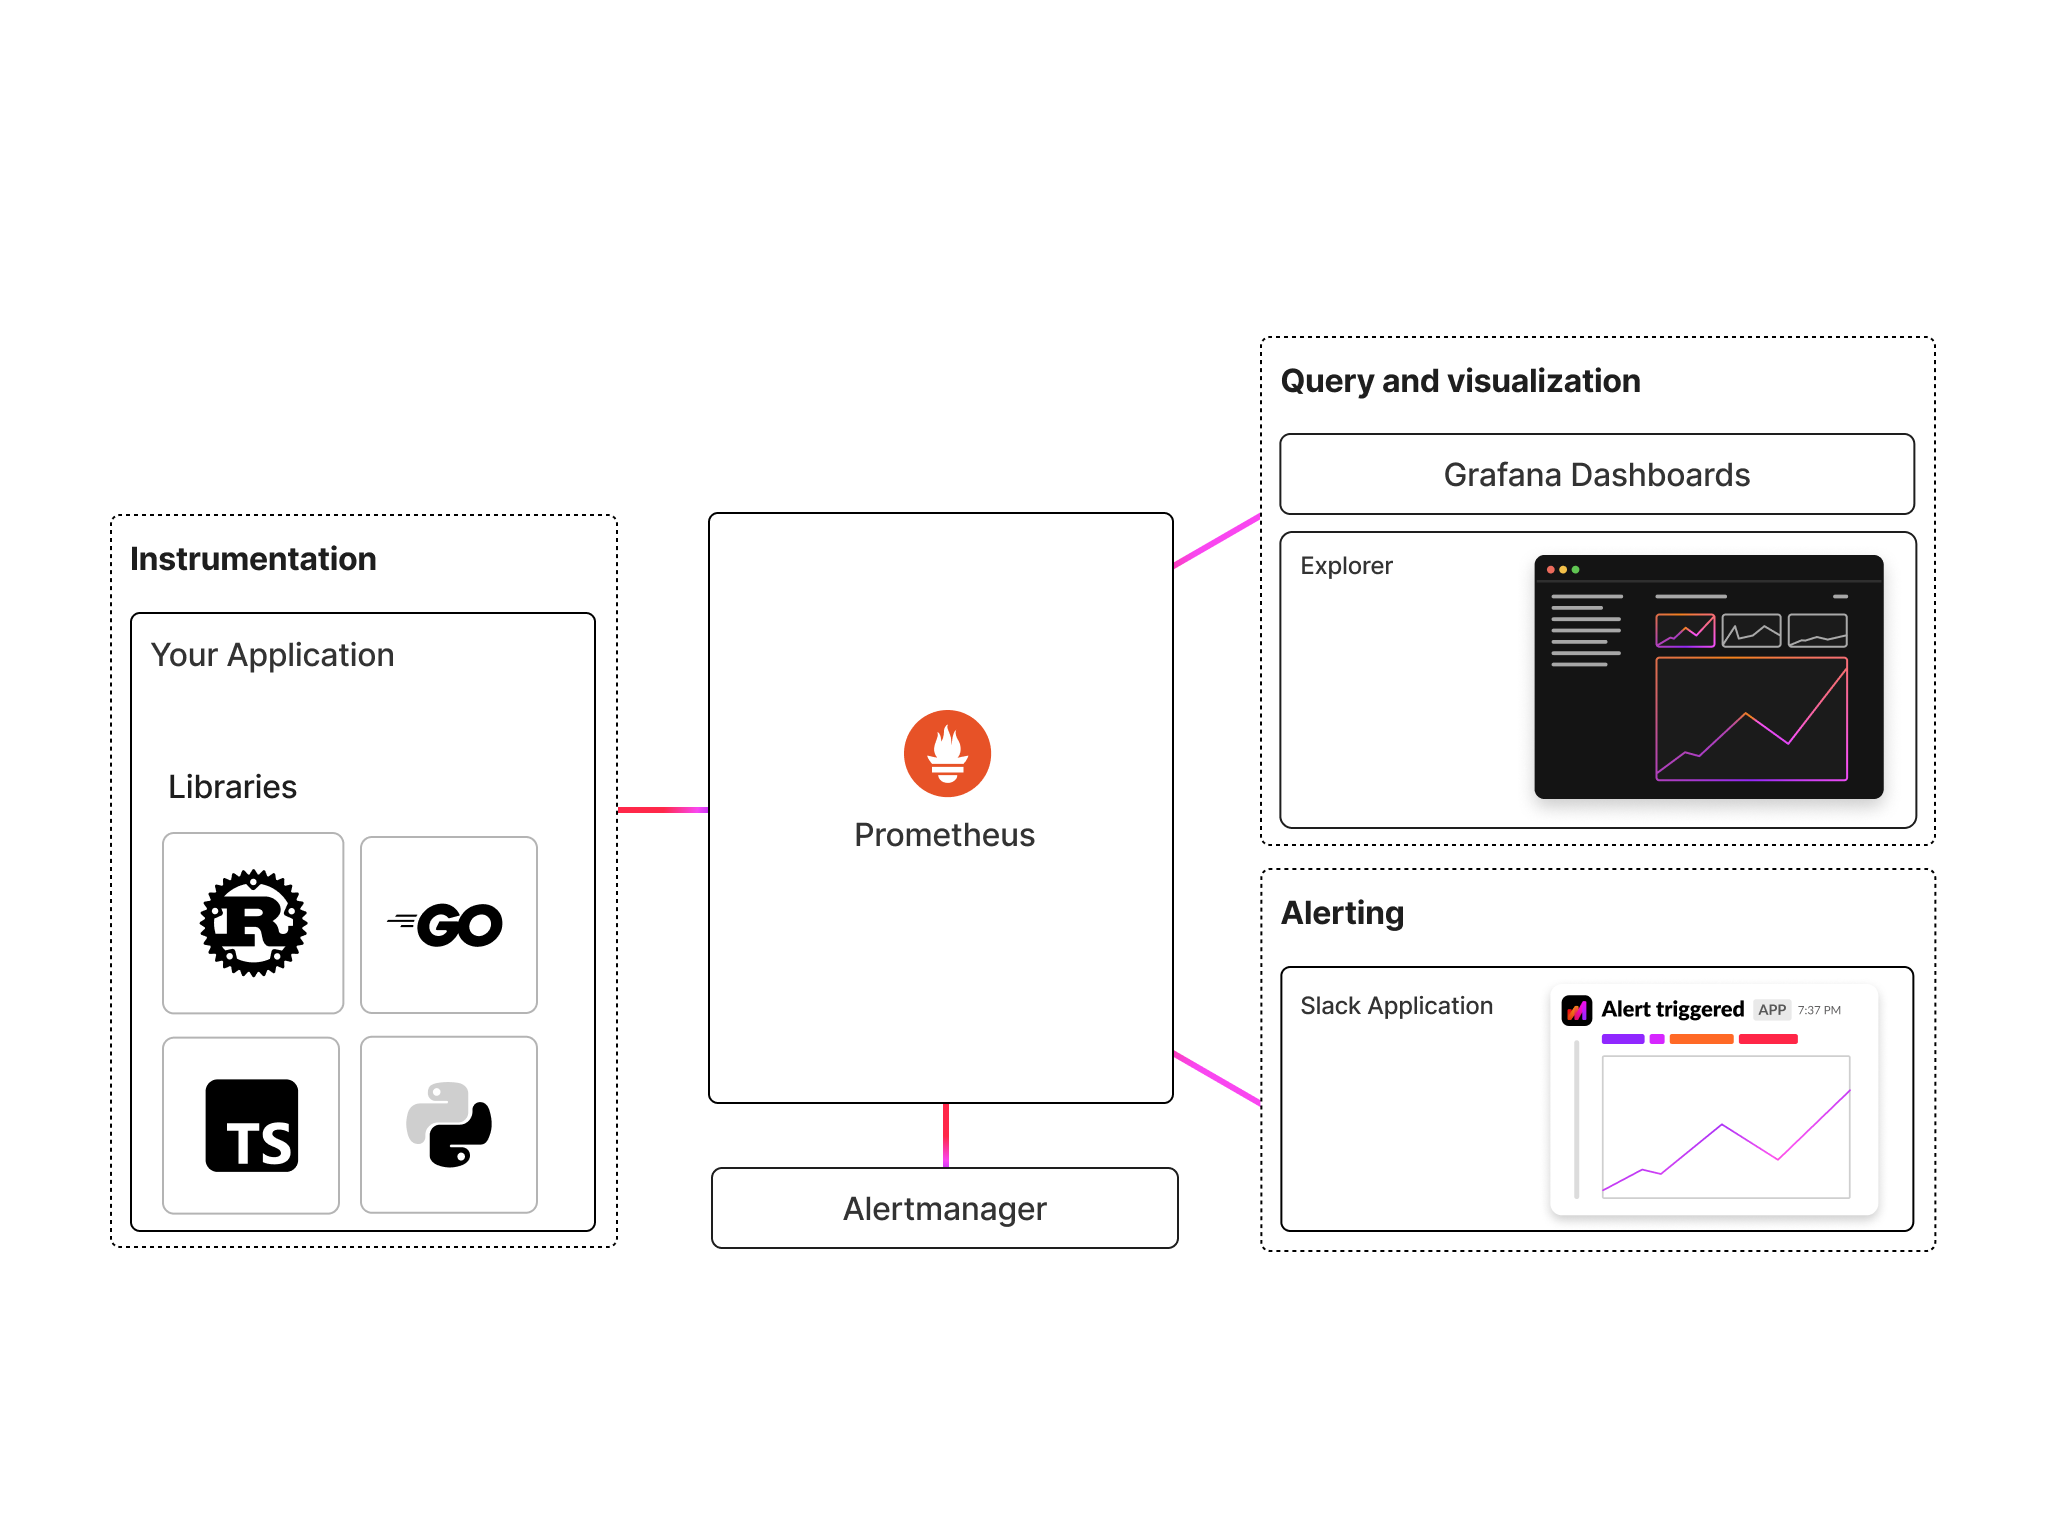
You can start working with Autometrics as early as the first lines of your code and it can take you as far as alerting about issues in your team's Slack workspace.

Here are the basic steps to get you started:
Install the library
Autometrics is currently available in Rust, JavaScript/TypeScript, and Python, Go. To get started, follow the instructions for each language:
Install Prometheus + Alertmanager
Autometrics libraries export metrics in a Prometheus-compatible format. In order to store and query them you can deploy a Prometheus server in your stack
Deploy Explorer
Autometrics Explorer is a special interface that connects with your Prometheus and helps you analyze your Autometrics-generated data more easily. It is a simple client app available at explorer.autometrics.dev or deployable as a Docker image as well.
Deploy Slack application
Finally, Autometrics includes a special-built Slack application that connects with your Prometheus Alertmanager and offers a simple workflow for monitoring and responding to alerts.