Local development
Autometrics CLI enables a proper local workflow for developer metrics. You can add, test, and see the immediate effect of adding metrics to your functions in the Explorer UI. Your changes now won't require a full cycle of change-commit-deploy-to-dev to see if it shows up as you intended in your monitoring dashboard.
Why locally?
- Iterate faster. Add, change, and validate metrics locally without having to commit and deploy to dev.
- Collaborate easier. Anyone on the team can experiment and share learnings from metrics without lengthy setup.
How it works
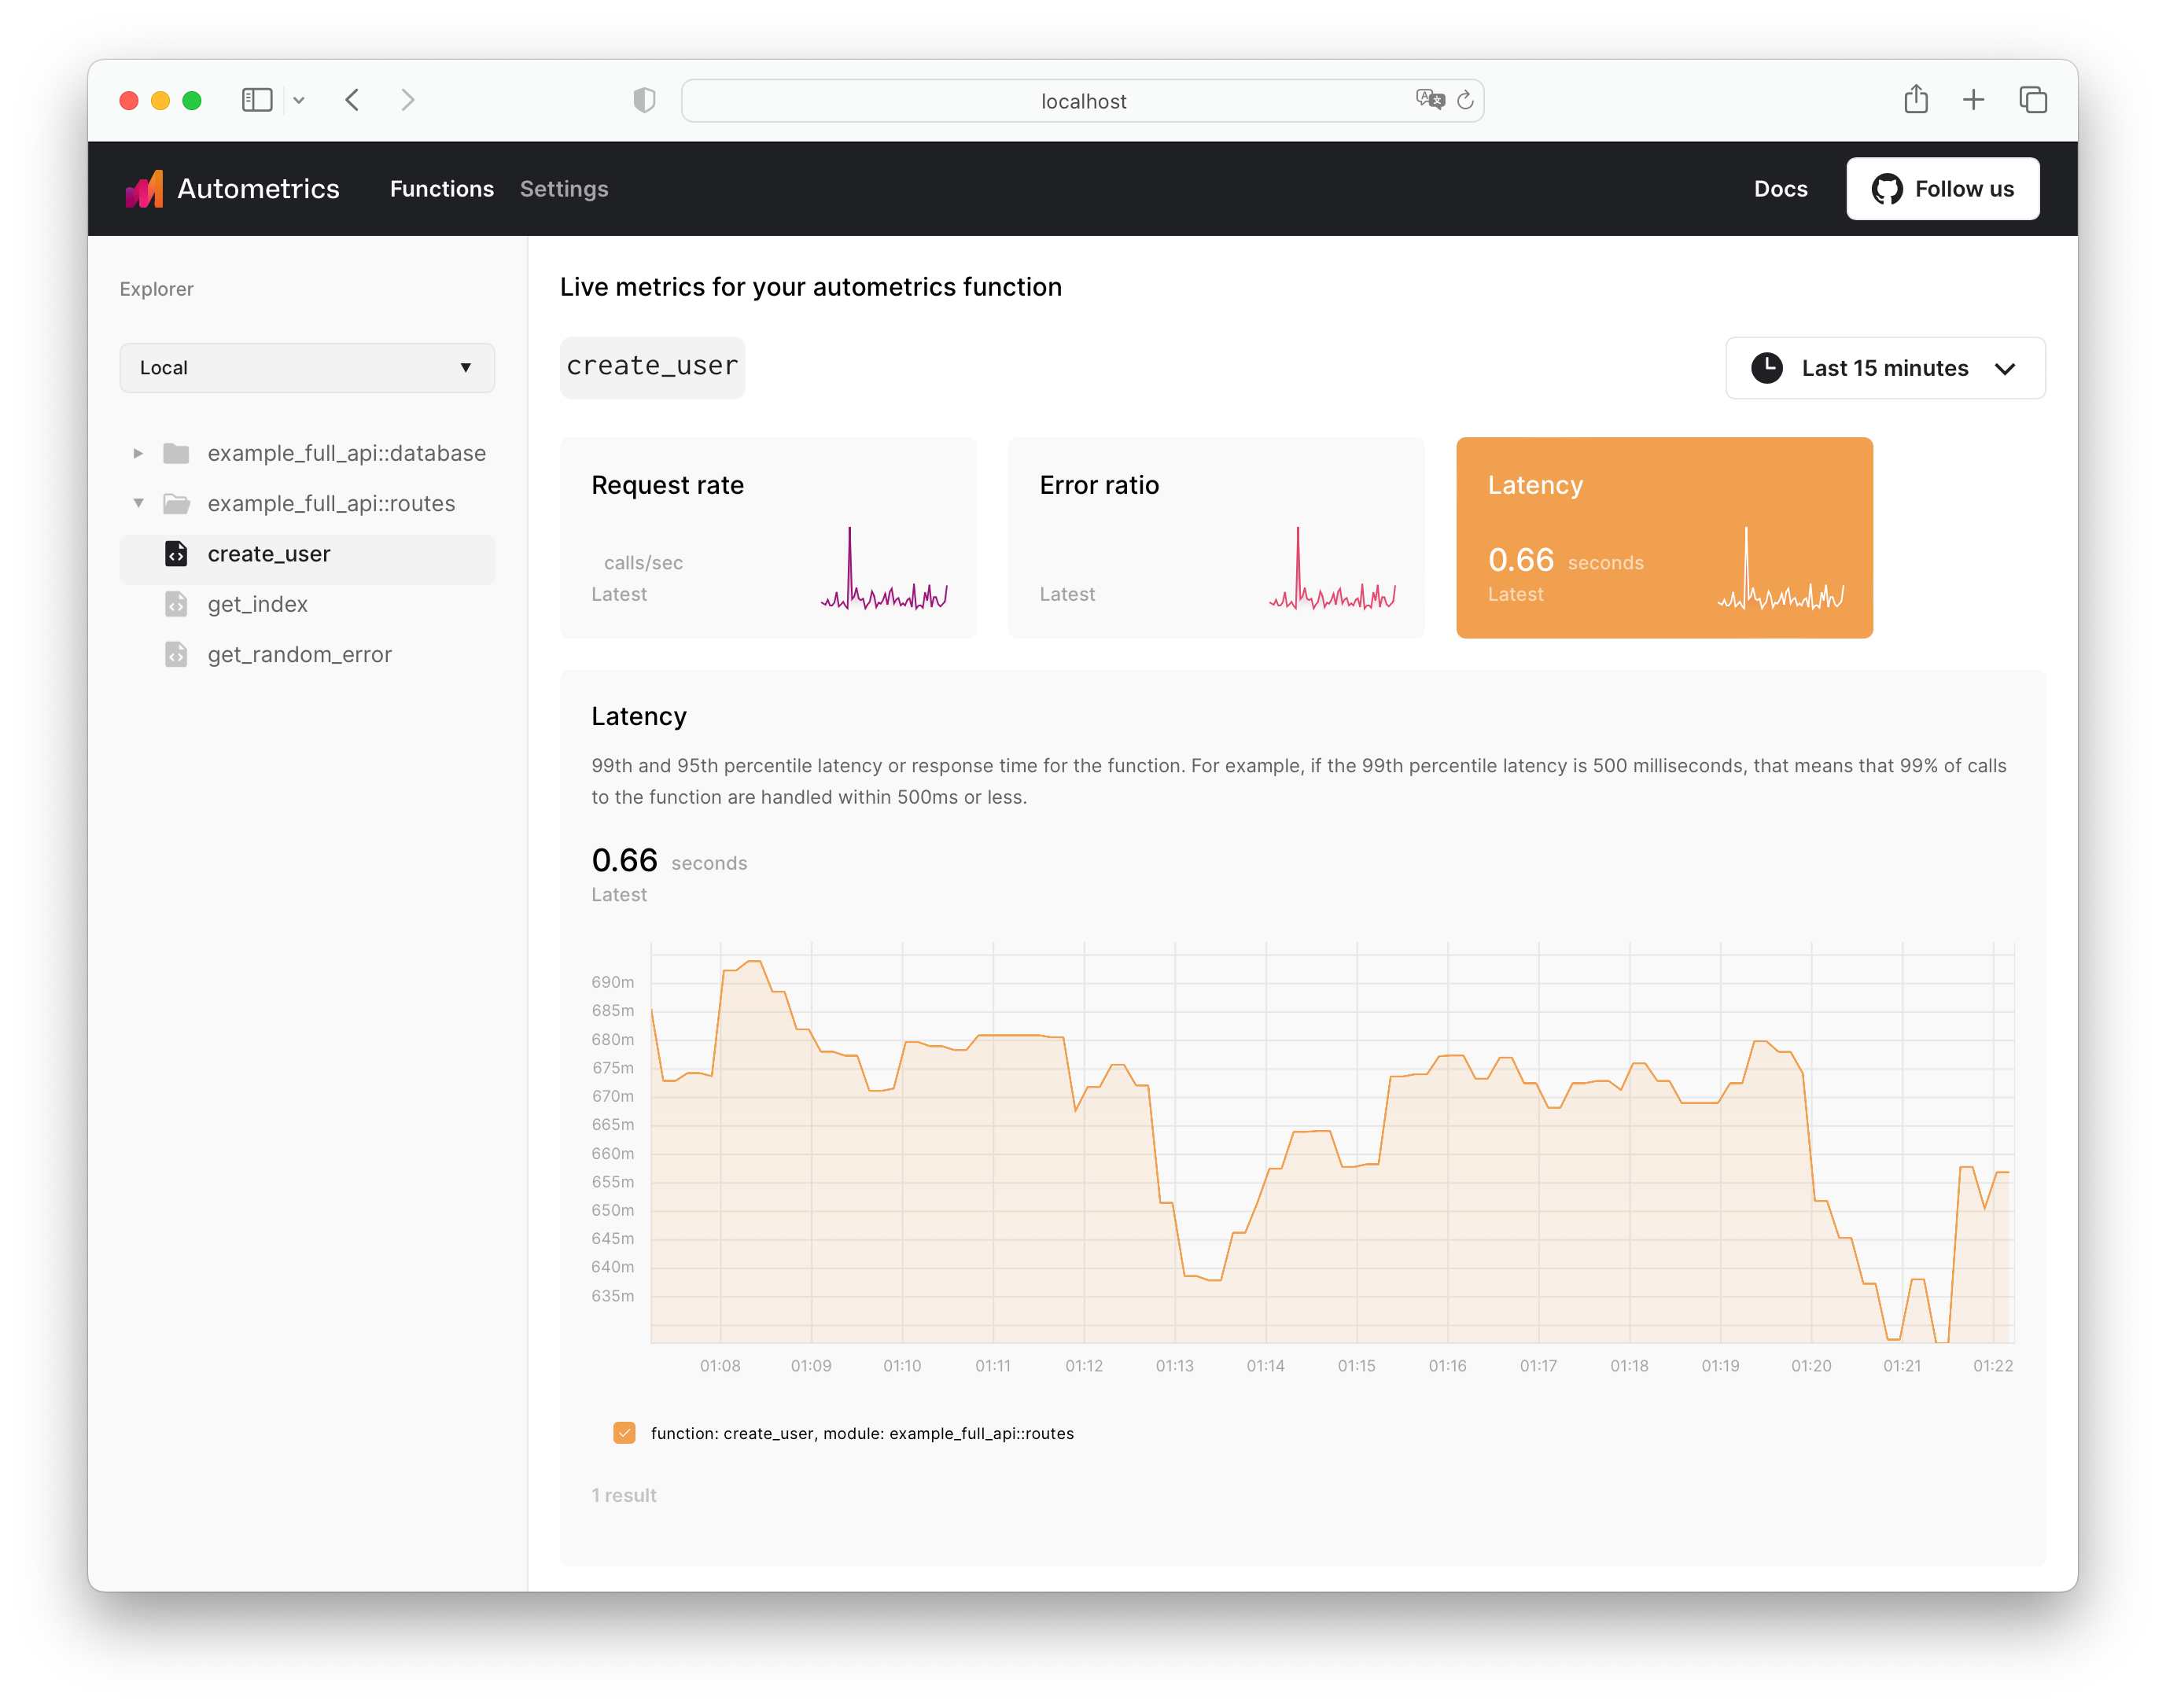
Autometrics CLI is a simple utility that wraps a Prometheus server and includes the Explorer web interface that helps you see all of your Autometrics-instrumented functions and the metrics they generate.
When you run am start <METRICS_ENDPOINTS> in your terminal, the CLI will check if you have an available Prometheus binary on your computer. If not, it will download the latest version of Prometheus and start it on the port you specified.
It will also start a web server (by default on localhost:6789) with the Autometrics Explorer in which you can explore your instrumented functions and see the metrics they generate.
A quick note on how Prometheus works:
Prometheus is a popular open-source monitoring solution that is used by many companies to collect metrics from their applications. It is a pull-based system (opens in a new tab), meaning that it periodically polls the metrics endpoints of your applications to collect the metrics.
Therefore, you have to pass in the endpoints when running am start as arguments - Prometheus needs to know where to look for the data.
Getting started with am
Install the CLI
You can install the CLI using Homebrew or by downloading the binary directly.
brew install autometrics-dev/tap/amStart Prometheus and Explorer UI
You can then start the Prometheus server and Explorer by running the following command in your terminal:
./am start <METRICS_ENDPOINTS><METRICS_ENDPOINTS> - one or more port number + URL path combinations that expose metrics in the Prometheus format. The format you express your endpoint is quite flexible so any of the following will work:
METRICS_ENDPOINT | Resolved URL |
|---|---|
am start :3000 | http://localhost:3000/metrics (opens in a new tab) |
am start 127.0.0.1 | http://127.0.0.1:80/metrics (opens in a new tab) |
am start https://127.0.0.1 | https://127.0.0.1:443/metrics (opens in a new tab) |
am start localhost:3030 | http://localhost:3030/metrics (opens in a new tab) |
am start localhost:3030/api/metrics | http://localhost:3030/api/metrics (opens in a new tab) |
am start localhost:3030/api/observability | http://localhost:3030/api/observability (opens in a new tab) |
Go to the Explorer
You can now navigate to http://localhost:6789 (opens in a new tab) to see the Explorer. You can also see the Prometheus at http://localhost:9090 (opens in a new tab).
Configuration
am can be configured for each of your projects. In your project repository you
can add a am.toml configuration file wherein you can define defaults when
using am start.
Example
The following example shows all the different configuration items. This will start a pushgateway and adds two endpoints for Prometheus to sample the metrics from:
pushgateway-enabled = true
prometheus-scrape-interval = "1m"

[[endpoint]]
job-name = "main_app"
url = "http://localhost:3030"
prometheus-scrape-interval = "5s"

[[endpoint]]
job-name = "another_app"
url = "http://localhost:9090"
Configuration reference
This section describes all the configuration items that can be used in the
am.toml file.
| Item | Type | Description |
|---|---|---|
pushgateway-enabled | boolean | Whether to enable the Pushgateway |
prometheus-scrape-interval | string | Default scrape interval for all endpoints (For example 5s for 5 seconds, 10m for 10 minutes) |
[[endpoint]] | array of inline tables | An array of inline table endpoint configurations |
Endpoint
| Item | Type | Description |
|---|---|---|
job-name | string | Job name as defined in Prometheus (needs to be unique) |
url | string | URL to the metrics endpoint (can use the shorthand notation) |
prometheus-scrape-interval | string | Scrape interval for this endpoint (For example 5s for 5 seconds, 10m for 10 minutes) |
See the CLI reference for more details on the CLI commands and options.