Setting up SLOs in Fastify
In this guide, we will explore Service Level Objectives (SLOs), their benefits when used for alerting, and provide a step-by-step walkthrough on implementing them in .
Why SLOs
How do you know your application is working correctly after you have deployed it? You will likely want to use some form of alerts to notify you if the service is down.
SLOs empower engineers to establish user-centric alerts. These alerts, which focus on metrics like response and error rates, closely align with a user's experience. By design, SLO alerts often serve as an early warning, akin to detecting a "gas leak," allowing proactive measures before issues escalate.
How SLOs work
SLO alerting works on two principal ideas: error budgets and burn rates.
An error budget is a measure of the acceptable level of errors or service disruptions that a service can experience during a specified timeframe, without violating its agreed-upon reliability target. It can be represented as:
So for an SLO of 99% the error budget is:
The burn rate represents the pace at which the error budget is being consumed or "burned" by errors within a system or service. A burn rate of 1 or less indicates that the service is currently burning its error budget at a rate that aligns with the SLO targets. Conversely, a burn rate exceeding 1 indicates that the service is burning its error budget too quickly, which would result in a failed SLO if not addressed.
The burn rate makes up the basis of the SLO-based alert.
One final note before we dive in: SLOs are a blend of science and art. While this guide provides a solid starting point, it's important to customize the values to align with your specific business requirements and processes.
The best way to learn to use SLOs, like any engineering concept, is to go build with them.
Implementing SLOs in Fastify (using Autometrics)
Alright, now let's jump into the heart of this guide.
Pre-requisites
- Autometrics library for TypeScript/JavaScript: Make sure you have the Autometrics library installed. See the quickstart for installation instructions.
- Prometheus: Autometrics is designed to work with Prometheus, a powerful open-source monitoring and alerting database. To get started quickly, you can use the Autometrics CLI or download the binary directly.
We will use SLO-based alerts to enhance a simple Fastify API. This API sits in front of a user directory, and it accepts requests to create, update, and delete users.
Our API code is divided into two files:
- server.ts
- routes.ts
server.ts- This is our main entry point. We'll mostly focus on this file throughout the guide.
import { fastify } from "fastify";
import {
  handleCreateUser,
  handleDeleteUser,
  handleUpdateUser,
  handleGetAllUsers,
  handleGetUserById,
} from "./routes.js";

const app = fastify({logger: true});

app.get("/users", handleGetAllUsers);
app.get("/users/:id", handleGetUserById);
app.post("/users", handleCreateUser);
app.put("/users/:id", handleUpdateUser);
app.delete("/users/:id", handleDeleteUser);

const port = 3000

app.listen({port}, (err, address) => {
	if (err) {
		app.log.error(err);
		process.exit(1);
	}
	app.log.info(`Server listening on ${address}`);
})routes.ts- This is where all of our handlers are defined.
import { FastifyRequest, FastifyReply } from "fastify";


export function handleGetAllUsers(req: FastifyRequest, res: FastifyReply) {
  // ...
}

export function handleGetUserById(req: FastifyRequest, res: FastifyReply) {
  // ...
}

export function handleCreateUser(req: FastifyRequest, res: FastifyReply) {
  // ...
}

export function handleUpdateUser(req: FastifyRequest, res: FastifyReply) {
  // ...
}

export function handleDeleteUser(req: FastifyRequest, res: FastifyReply) {
  // ...
}
We'll ignore the function body of our route handlers (// ...) as for the purpose for this guide they're not that relevant - Autometrics requires no changes to your function implementation to add the necessary metrics.
Adding Autometrics to the project
Our first step is to generate the necessary metrics for our SLOs. We can do this by wrapping our route handlers with the autometrics higher order function.
import { autometrics } from "@autometrics/autometrics";
import { fastify } from "fastify";

//...

const app = fastify({logger: true});

app.get("/users", autometrics(handleGetAllUsers));
app.get("/users/:id", autometrics(handleGetUserById));
app.post("/users", autometrics(handleCreateUser));
app.put("/users/:id", autometrics(handleUpdateUser));
app.delete("/users/:id", autometrics(handleDeleteUser));
You can use the same autometrics interface to wrap other functions that are called inside your handlers. For example, you could also wrap functions that interact with the database or implement critical business logic.
It's quite simple: The more you add, the more comprehensive and informative the metrics data will become, allowing you to build a clearer picture of your system's performance.
For each function above, autometrics will generate metrics to answer core questions about availability, such as:
- Rate: How many requests has this function received?
- Error: How many of the requests errored?
- Duration: How long do the requests take?
These are the basic building blocks that we'll use for our Service Level Objectives.
Creating an SLO
We can create our SLO in the same server.ts file. The @autometrics/autometrics library includes helper utilities for SLOs: Objective, ObjectiveLatency, ObjectivePercentile.
import {
  autometrics,
  Objective,
  ObjectiveLatency,
  ObjectivePercentile,
} from "@autometrics/autometrics";
import { fastify } from "fastify";

// ...
Using these utilities, we define our SLOs as a plain-old-javascript-object, which we can then pass to each of our autometrics wrapped handlers.
Here's how that works:
const API_SLO: Objective = {
  name: "api",
  successRate: ObjectivePercentile.P99,
  latency: [ObjectiveLatency.Ms250, ObjectivePercentile.P99],
};
First, we create an Objective object that we call API_SLO. We give the objective a descriptive name and two parameters: successRate and latency. These will be used to create two SLOs - one for error rates and one for latency.
The successRate accepts a predefined precentile value (from the enum ObjectivePercentile). For example, ObjectivePercentile.P99 would define a success rate of 99% for the objective.
The latency accepts a tuple [A, B] which should include the latency goal in milliseconds and, similarly, a percentile. So: [ObjectiveLatency.Ms250, ObjectivePercentile.P99] translates to: "We expect 99% of requests to be completed within 250 milliseconds."
Adding SLOs to our functions
For each function we want to group into our SLOs, we simply pass in our newly created API_SLO as the objective property in the options parameter.
For our user directory application, we will group all of our handlers into one objective. However, in real usage you can extend it to group any underlying important functions as well.
import {
  autometrics,
  Objective,
  ObjectiveLatency,
  ObjectivePercentile,
} from "@autometrics/autometrics";
import { fastify } from "fastify";

//...

const app = fastify();

const API_SLO: Objective = {
  name: "api",
  successRate: ObjectivePercentile.P99,
  latency: [ObjectiveLatency.Ms250, ObjectivePercentile.P99],
};

app.get("/users", autometrics({ objective: API_SLO }, handleGetAllUsers));
app.get("/users/:id", autometrics({ objective: API_SLO }, handleGetUserById));
app.post("/users", autometrics({ objective: API_SLO }, handleCreateUser));
app.put("/users/:id", autometrics({ objective: API_SLO }, handleUpdateUser));
app.delete("/users/:id", autometrics({ objective: API_SLO }, handleDeleteUser));
Setting custom error values
Autometrics by default registers an error when a given function throws an Error object. In top level functions like handlers we rarely want to throw the error back to user - it is a good practice to wrap any other function calls in the body of the function in a try...catch and return more informative errors to the user.
To make sure Autometrics register the error correctly, you can pass in a recordErrorIf callback to determine whether to register the result as an error based on the return value.
For example in this case we want to register an error any time a route handler returns HTTP codes 4xx and 5xx. We can define the callback:
const recordErrorIf = (res: FastifyReply) => {
  return res.statusCode >= 400 && res.statusCode <= 599;
};
And pass in this callback to the same AutometricsOptions object:
const recordErrorIf = (res: express.Response) => {
  return res.statusCode >= 400 && res.statusCode <= 599;
};

app.get(
  "/users",
  autometrics({ recordErrorIf, objective: API_SLO }, handleGetAllUsers)
);
app.get(
  "/users/:id",
  autometrics({ recordErrorIf, objective: API_SLO }, handleGetUserById)
);
app.post(
  "/users",
  autometrics({ recordErrorIf, objective: API_SLO }, handleCreateUser)
);
app.put(
  "/users/:id",
  autometrics({ recordErrorIf, objective: API_SLO }, handleUpdateUser)
);
app.delete(
  "/users/:id",
  autometrics({ recordErrorIf, objective: API_SLO }, handleDeleteUser)
);
Viewing the SLOs
That's all for the code-writing part!
Autometrics will now emit metrics with special labels that Prometheus can group into. You can check out more how this works under the hood in this blog post (opens in a new tab).
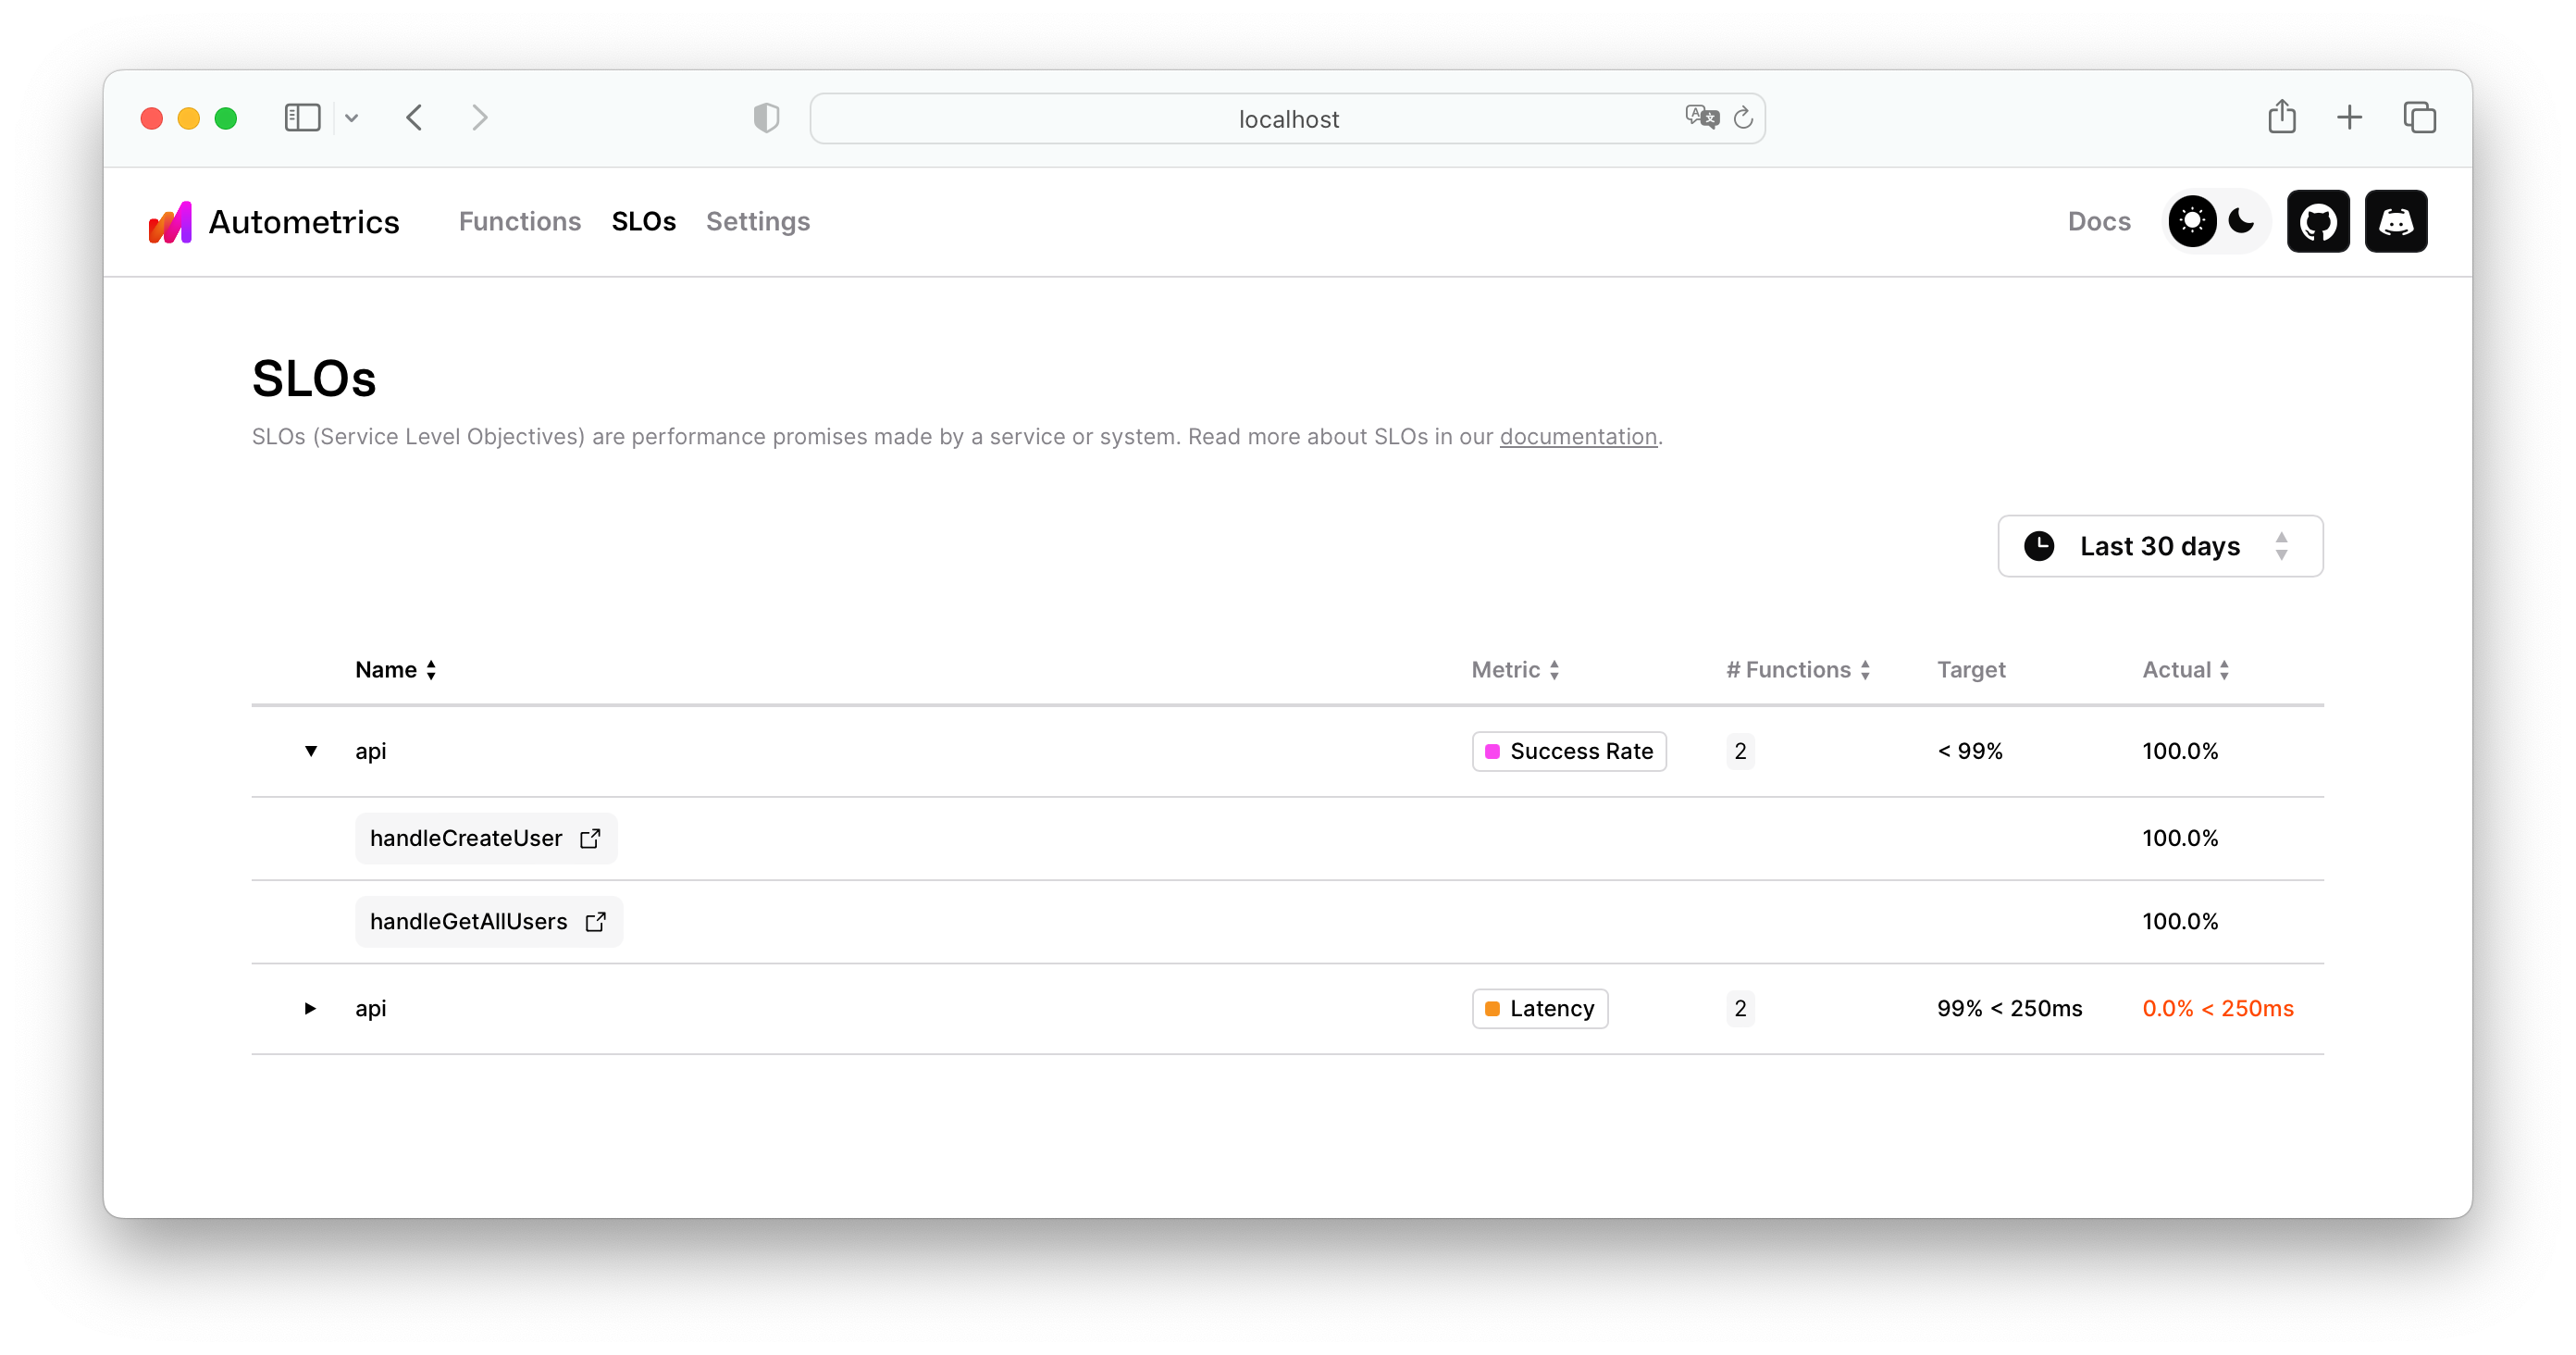
You can preview and validate the SLOs using the Autometrics CLI and Explorer. Navigate to the "SLO" tab in the top left to see an overview list of the SLOs you've just created (our example should have a single item named "api").
If you're using Grafana you can load one of the pre-made Autometrics dashboards (opens in a new tab). You don't need to configure the dashboard - it will automatically pick up all Autometrics-generated data from your Prometheus and show a helpful SLO overview panel with the current score on the left side and the functions that comprise that SLO on your right.
Configuring Alerts
Finally, based on this you can set up alerts inside Prometheus.
Grab the Autometrics alerting rule-set and append it to your Prometheus configuration. No need to configure anything else - the alerts will be dormant by default and activate only when they find SLO labels on Autometrics-instrumented data.
You can validate that the alerts are set by navigating to the "Alerts" tab in Prometheus UI.
Recap
And we're set!
We started off with a simple Fastify application and in a few steps instrumented our service to report the basic metrics required to assess its health: rate, errors, and duration. On top of that we've grouped them into a Service Level Objective (SLO) to help us give a more structured insight into a question: is our service running smoothly for the users. This enabled us to add smarter alerts based on that data.
As mentioned earlier, SLOs are an art as much as science: a week after deploying this you will probably need to tweak them to your needs. The good news is that the only thing you need to change is the API_SLO object we've created at the beginning.